首页 / 产品 / ELISA试剂盒 / 小鼠ELISA试剂盒

Intra-assay Precision (Precision within an assay): CV%<8% | |||||||||||
Three samples of known concentration were tested twenty times on one plate to assess. | |||||||||||
Inter-assay Precision (Precision between assays):CV%<10% | |||||||||||
Three samples of known concentration were tested in twenty assays to assess. | |||||||||||
| Intra-Assay PrecisionInter-Assay PrecisionSample123123n202020202020Mean(pg/ml)126.466124.651125.202125.967124.971126.858SD0.0280.0300.0270.0350.0370.034CV(%)5.2345.6615.0806.5596.9716.342 | |||||||||||
To assess the linearity of the assay, samples were spiked with high concentrations of mouse Flt-3L in various matrices and diluted with the Sample Diluent to produce samples with values within the dynamic range of the assay. | |||||||||||||
Sample | Serum(n=4) | ||||||||||||
1:1 | Average % | 105 | |||||||||||
Range % | 97-110 | ||||||||||||
1:2 | Average % | 101 | |||||||||||
Range % | 96-105 | ||||||||||||
1:4 | Average % | 98 | |||||||||||
Range % | 91-100 | ||||||||||||
1:8 | Average % | 94 | |||||||||||
Range % | 88-99 | ||||||||||||
The recovery of mouse Flt-3L spiked to levels throughout the range of the assay in various matrices was evaluated. Samples were diluted prior to assay as directed in the Sample Preparation section. | |||||||||||||
Sample Type | Average % Recovery | Range | |||||||||||
Serum (n=5) | 103 | 95-109 | |||||||||||
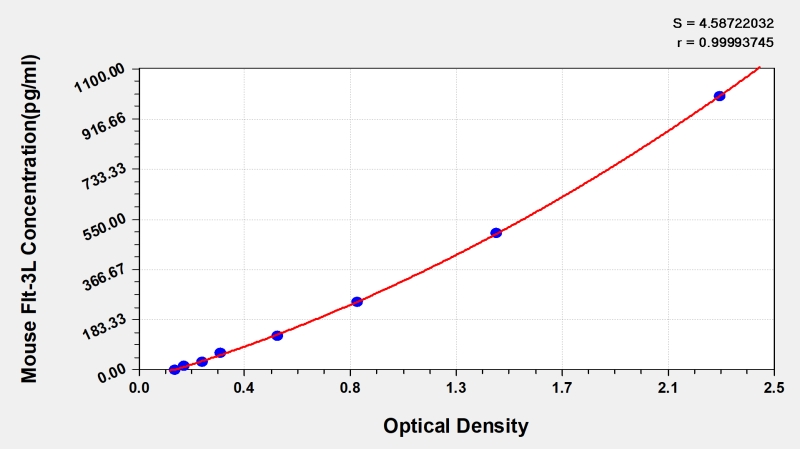
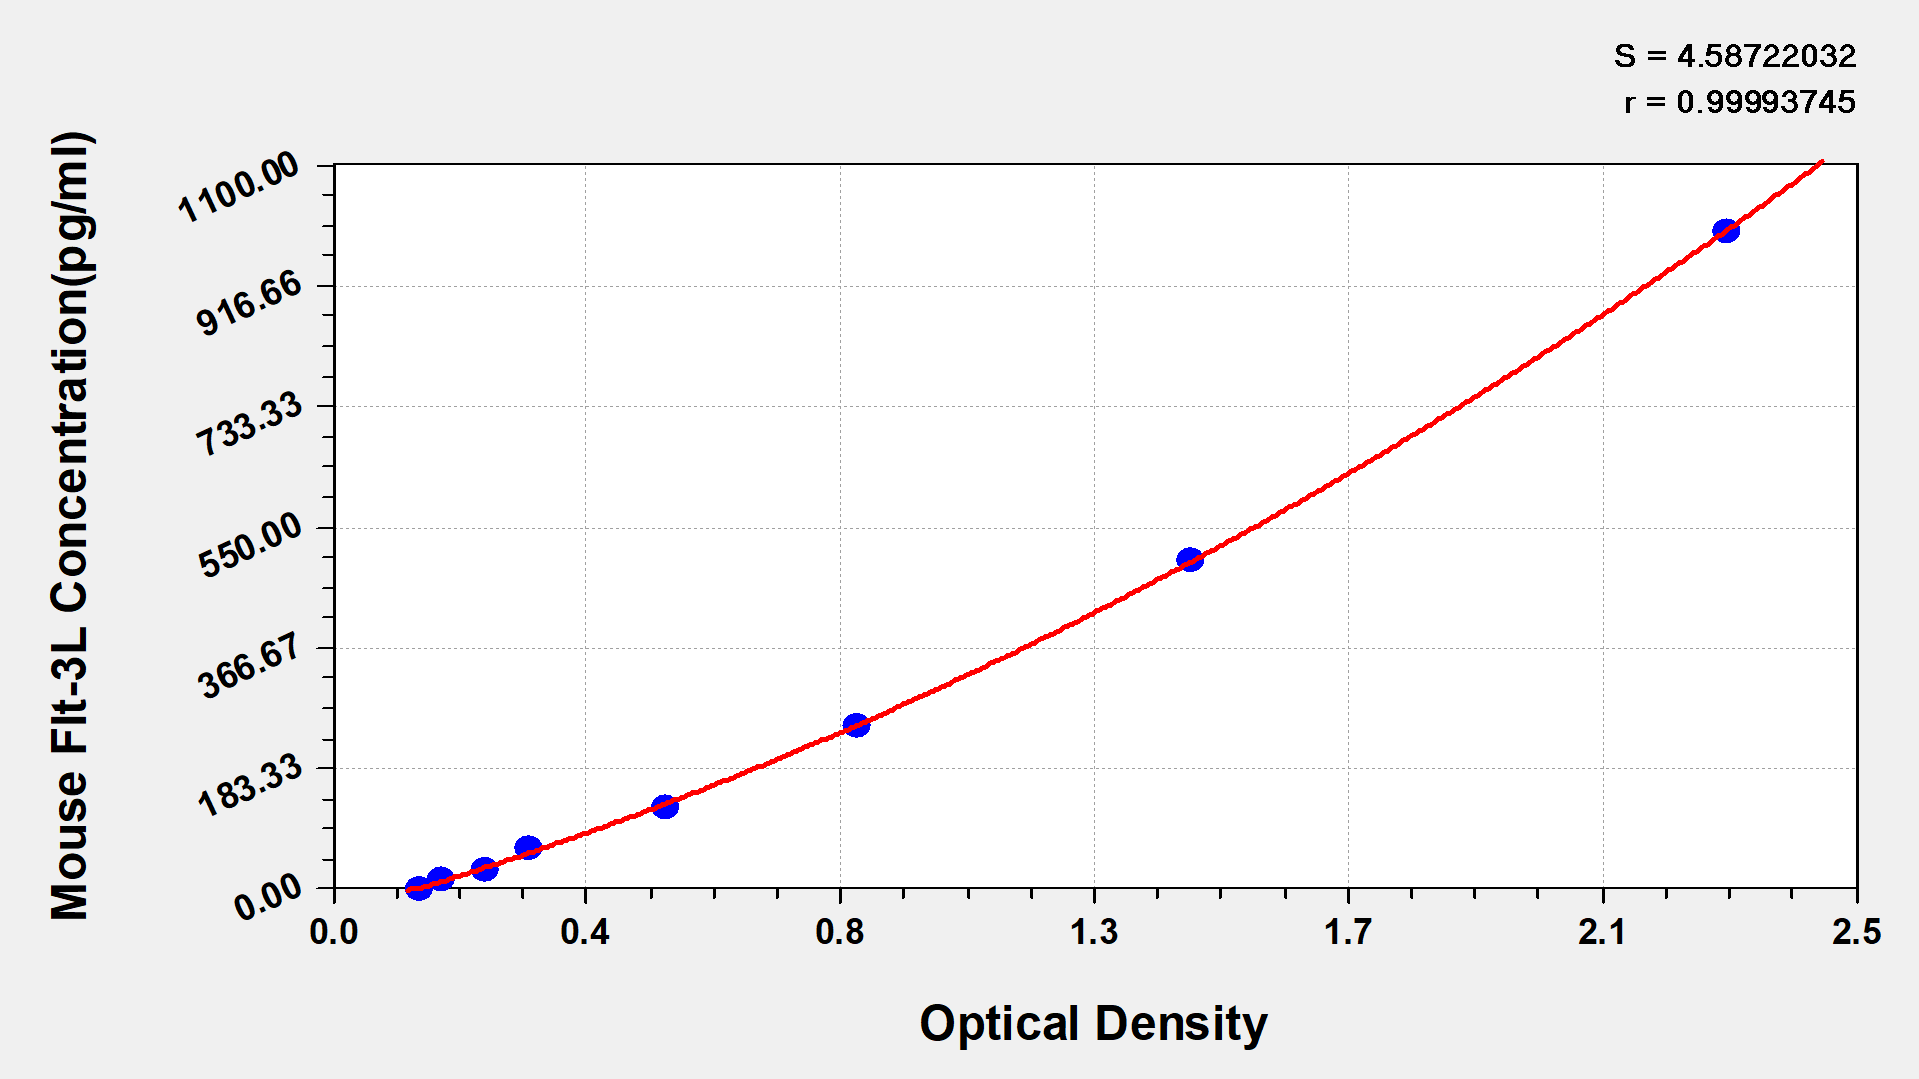
These standard curves are provided for demonstration only. A standard curve should be generated for each set of samples assayed. | ||||||||||||
| ||||||||||||
pg/ml | OD1 | OD2 | Average | Corrected | ||||||||
1000 | 2.233 | 2.356 | 2.294 | 2.138 | ||||||||
500 | 1.422 | 1.414 | 1.418 | 1.262 | ||||||||
250 | 0.888 | 0.856 | 0.872 | 0.716 | ||||||||
125 | 0.583 | 0.540 | 0.561 | 0.405 | ||||||||
62.5 | 0.339 | 0.334 | 0.337 | 0.181 | ||||||||
31.2 | 0.271 | 0.257 | 0.264 | 0.108 | ||||||||
15.6 | 0.199 | 0.188 | 0.193 | 0.037 | ||||||||
0 | 0.154 | 0.158 | 0.156 | |||||||||
×
