首页 / 产品 / ELISA试剂盒 / 人ELISA试剂盒

Intra-assay Precision (Precision within an assay): CV%<8% | |||||||
Three samples of known concentration were tested twenty times on one plate to assess. | |||||||
Inter-assay Precision (Precision between assays): CV%<10% | |||||||
Three samples of known concentration were tested in twenty assays to assess. | |||||||
| Intra-Assay PrecisionInter-Assay PrecisionSample123123n202020202020Mean(pg/ml)113.616109.567118.700121.407123.326117.167SD0.0320.0430.0380.0430.0490.052CV(%)4.1745.8734.8265.4026.0876.701 | |||||||
To assess the linearity of the assay, samples were spiked with high concentrations of human TGF-βRⅡ in various matrices and diluted with the Sample Diluent to produce samples with values within the dynamic range of the assay. | |||||||
Sample | Serum(n=4) | ||||||
1:2 | Average % | 118 | |||||
Range % | 108-120 | ||||||
1:4 | Average % | 111 | |||||
Range % | 94-118 | ||||||
1:8 | Average % | 102 | |||||
Range % | 94-105 | ||||||
1:16 | Average % | 94 | |||||
Range % | 88-104 | ||||||
The recovery of human TGF-βRⅡ spiked to levels throughout the range of the assay in various matrices was evaluated. Samples were diluted prior to assay as directed in the Sample Preparation section. | |||||||
Sample Type | Average % Recovery | Range | |||||
Serum (n=5) | 102 | 94-115 | |||||
EDTA plasma (n=4) | 103 | 96-118 | |||||
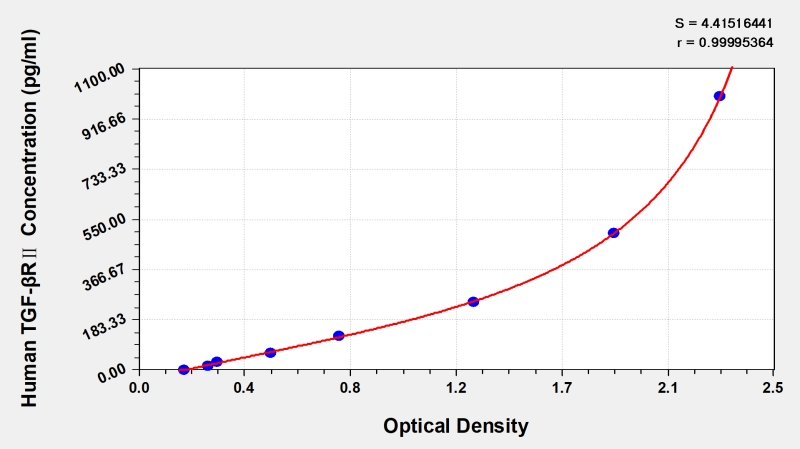
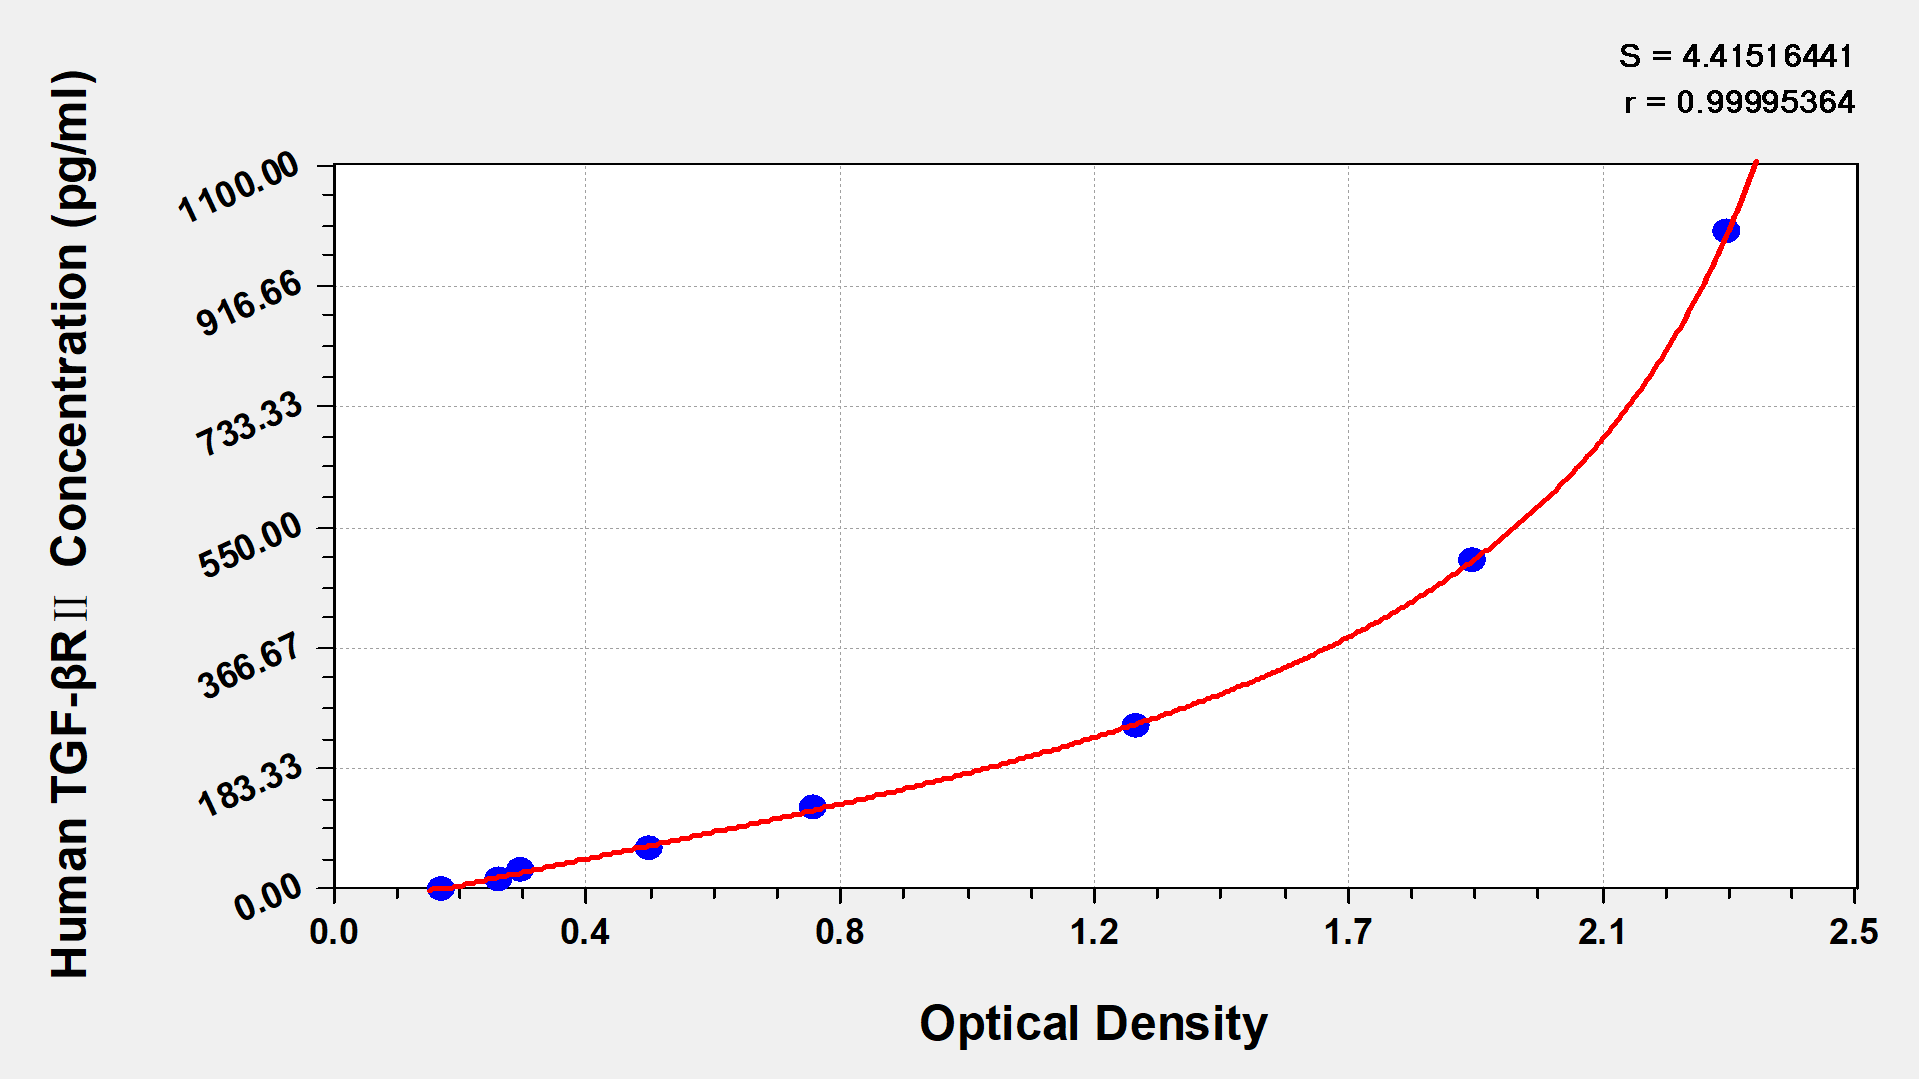
These standard curves are provided for demonstration only. A standard curve should be generated for each set of samples assayed. | |||||||
| |||||||
pg/ml | OD1 | OD2 | Average | Corrected | |||
1000 | 2.246 | 2.285 | 2.266 | 2.074 | |||
500 | 1.828 | 1.879 | 1.854 | 1.662 | |||
250 | 1.347 | 1.281 | 1.314 | 1.122 | |||
125 | 0.793 | 0.792 | 0.793 | 0.601 | |||
62.5 | 0.524 | 0.535 | 0.530 | 0.338 | |||
31.2 | 0.332 | 0.314 | 0.323 | 0.131 | |||
15.6 | 0.286 | 0.283 | 0.285 | 0.093 | |||
0 | 0.187 | 0.196 | 0.192 | ||||
×
