首页 / 产品 / ELISA试剂盒 / 人ELISA试剂盒

Intra-assay Precision (Precision within an assay): CV%<8% | ||||||||||||
Three samples of known concentration were tested twenty times on one plate to assess. | ||||||||||||
Inter-assay Precision (Precision between assays): CV%<10% | ||||||||||||
Three samples of known concentration were tested in twenty assays to assess. | ||||||||||||
| Intra-Assay PrecisionInter-Assay PrecisionSample123123n202020202020Mean(ng/ml)2.3822.6292.4632.5642.5922.546SD0.0410.0430.0360.0490.0520.047CV(%)5.765.614.936.526.866.28 | ||||||||||||
To assess the linearity of the assay, samples were spiked with high concentrations of human E-selectin in various matrices and diluted with the Sample Diluent to produce samples with values within the dynamic range of the assay. | ||||||||||||
Sample | Serum(n=4) | |||||||||||
1:1 | Average % | 99 | ||||||||||
Range % | 95-110 | |||||||||||
1:2 | Average % | 95 | ||||||||||
Range % | 91-103 | |||||||||||
1:4 | Average % | 87 | ||||||||||
Range % | 82-92 | |||||||||||
1:8 | Average % | 94 | ||||||||||
Range % | 89-98 | |||||||||||
The recovery of human E-selectin spiked to levels throughout the range of the assay in various matrices was evaluated. Samples were diluted prior to assay as directed in the Sample Preparation section. | ||||||||||||
Sample Type | Average % Recovery | Range | ||||||||||
Serum (n=5) | 95 | 89-99 | ||||||||||
Heparin plasma (n=4) | 98 | 90-101 | ||||||||||
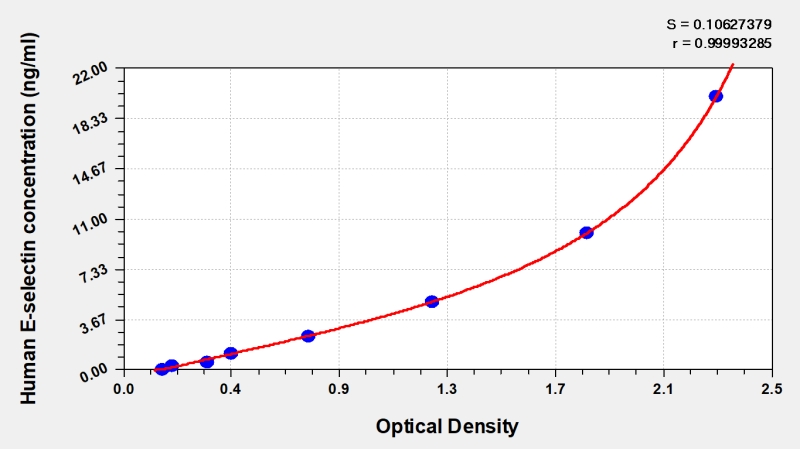
These standard curves are provided for demonstration only. A standard curve should be generated for each set of samples assayed. | ||||||||||||
| ||||||||||||
ng/ml | OD1 | OD2 | Average | Corrected | ||||||||
20 | 2.370 | 2.274 | 2.322 | 2.154 | ||||||||
10 | 1.859 | 1.779 | 1.819 | 1.651 | ||||||||
5 | 1.229 | 1.209 | 1.219 | 1.051 | ||||||||
2.5 | 0.740 | 0.734 | 0.737 | 0.569 | ||||||||
1.25 | 0.437 | 0.431 | 0.434 | 0.266 | ||||||||
0.625 | 0.347 | 0.339 | 0.343 | 0.175 | ||||||||
0.312 | 0.207 | 0.204 | 0.206 | 0.038 | ||||||||
0 | 0.168 | 0.167 | 0.168 | |||||||||
×
