首页 / 产品 / ELISA试剂盒 / 人ELISA试剂盒

Intra-assay Precision (Precision within an assay): CV%<8% | |||||||||||
Three samples of known concentration were tested twenty times on one plate to assess. | |||||||||||
Inter-assay Precision (Precision between assays): CV%<10% | |||||||||||
Three samples of known concentration were tested in twenty assays to assess. | |||||||||||
| Intra-Assay PrecisionInter-Assay PrecisionSample123123n202020202020Mean(ng/ml)12.72013.07912.87412.64312.82312.925SD0.0230.0270.0250.0360.0330.031CV(%)3.6224.1603.9005.6965.1644.821 | |||||||||||
To assess the linearity of the assay, samples were spiked with high concentrations of human Fetuin B in various matrices and diluted with the Sample Diluent to produce samples with values within the dynamic range of the assay. | |||||||||||
Sample | Serum(n=4) | ||||||||||
1:10 | Average % | 106 | |||||||||
Range % | 102-108 | ||||||||||
1:20 | Average % | 88 | |||||||||
Range % | 84-92 | ||||||||||
1:40 | Average % | 92 | |||||||||
Range % | 85-96 | ||||||||||
1:80 | Average % | 87 | |||||||||
Range % | 82-83 | ||||||||||
The recovery of human Fetuin B spiked to levels throughout the range of the assay in various matrices was evaluated. Samples were diluted prior to assay as directed in the Sample Preparation section. | |||||||||||
Sample Type | Average % Recovery | Range% | |||||||||
Serum (n=5) | 104 | 98-108 | |||||||||
EDTA plasma (n=4) | 98 | 94-102 | |||||||||
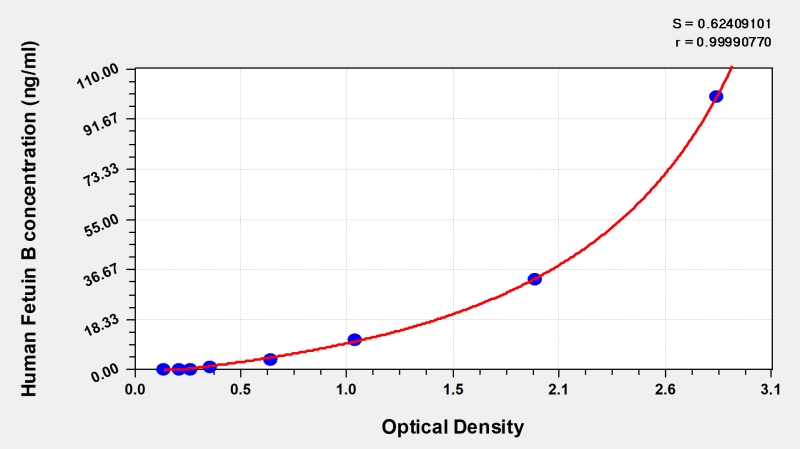
These standard curves are provided for demonstration only. A standard curve should be generated for each set of samples assayed. | |||||||||||
| |||||||||||
ng/ml | OD1 | OD2 | Average | Corrected | |||||||
100 | 2.775 | 2.859 | 2.817 | 2.665 | |||||||
33.33 | 1.951 | 1.937 | 1.944 | 1.792 | |||||||
11.11 | 1.090 | 1.062 | 1.076 | 0.924 | |||||||
3.7 | 0.642 | 0.691 | 0.666 | 0.514 | |||||||
1.23 | 0.385 | 0.364 | 0.375 | 0.223 | |||||||
0.41 | 0.283 | 0.285 | 0.284 | 0.132 | |||||||
0.137 | 0.218 | 0.235 | 0.226 | 0.074 | |||||||
0 | 0.151 | 0.153 | 0.152 | ||||||||
×
